Figure library
Reference · 19 figures · Both days
Every figure below is redrawn from the session records of the October 13–14 main-stage livestreams. Numbers, names, and quotes are verbatim from the cited talks, including their hedges. Where a record gives no numbers, the figure carries the claim as text instead of invented bars.
All session summaries · Day 1 digest · Day 2 digest
Concept diagrams
Section titled “Concept diagrams”The lethal trifecta
Section titled “The lethal trifecta”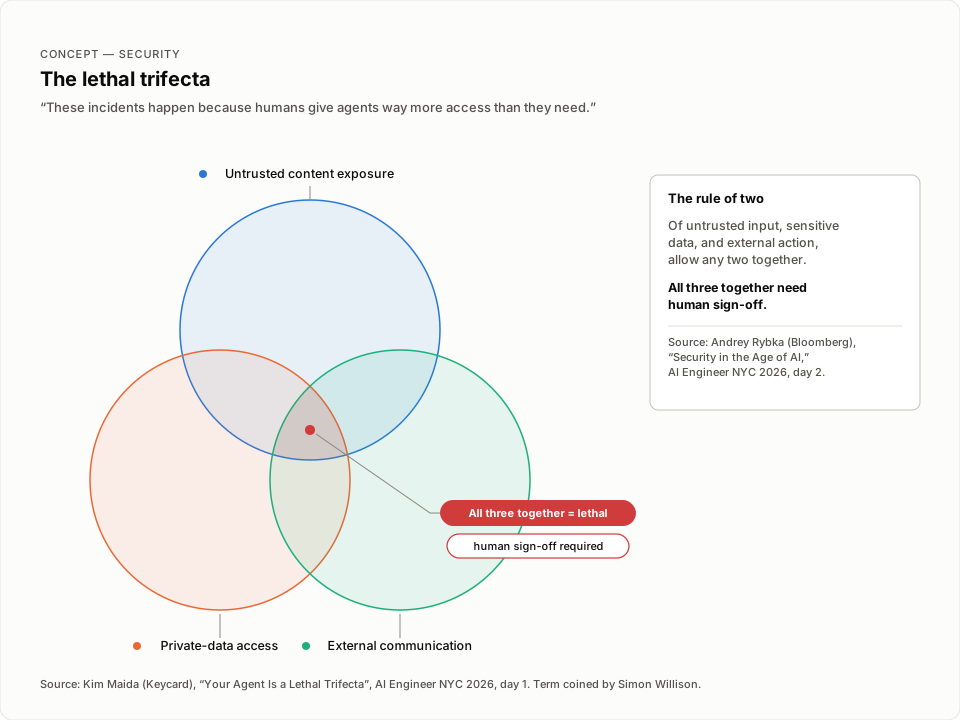
Read the figure description
A Venn diagram of three circles: untrusted content exposure, private-data access, and external communication. Each pair may coexist, but the center intersection, where all three overlap, is marked lethal with a human-sign-off-required chip. A side panel carries day two's rule of two from the Bloomberg talk.
Drawn from Your Agent Is a Lethal Trifecta · Security in the Age of AI: Recent Attacks, Incidents & Defenses.
Authorize per tool call, not per agent
Section titled “Authorize per tool call, not per agent”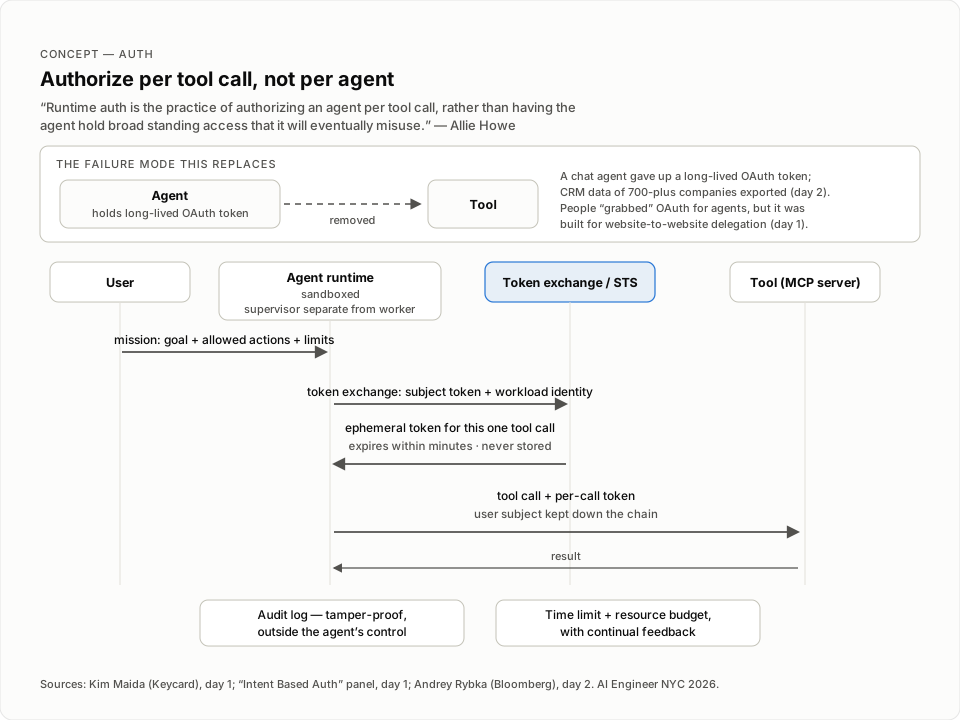
Read the figure description
A sequence diagram with four lanes: user, sandboxed agent runtime with a supervisor separate from the worker, token exchange security token service, and tool or MCP server. The user sends a mission of goal, allowed actions, and limits; the runtime exchanges the subject token for an ephemeral per-tool-call token that expires within minutes and is never stored; the user subject is kept down the chain. A contrast panel shows the replaced failure mode: an agent holding a long-lived OAuth token, drawn as a blocked dashed path.
Drawn from Intent Based Auth · Your Agent Is a Lethal Trifecta · Security in the Age of AI: Recent Attacks, Incidents & Defenses.
What a GPU co-tenant can learn from timing alone
Section titled “What a GPU co-tenant can learn from timing alone”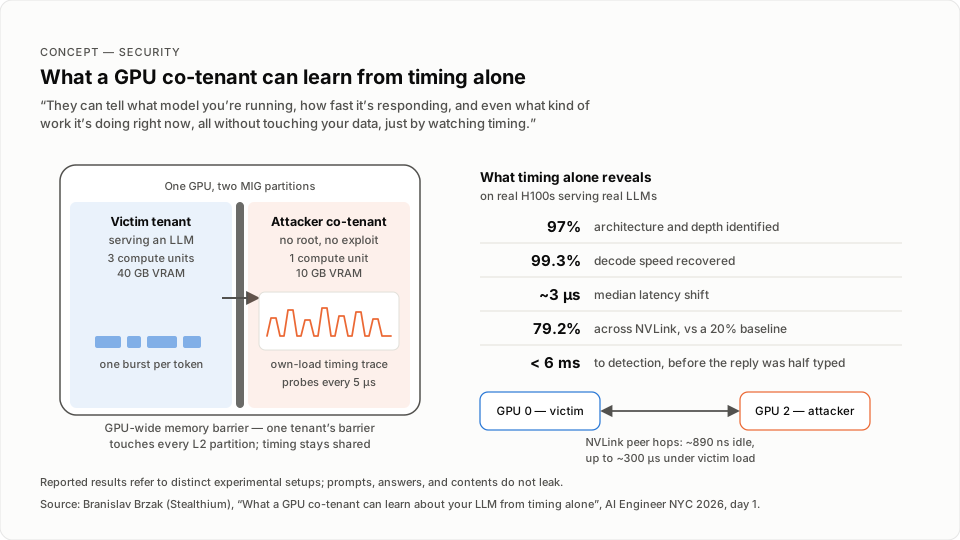
Read the figure description
One GPU drawn as a rounded chip split into two MIG partitions by the GPU-wide memory barrier: a blue victim tenant serving an LLM with token bursts, and an orange attacker co-tenant reading a latency sparkline of its own loads. A side list gives the reported results: architecture and depth within 97 percent, decode speed 99.3 percent, about 3 microseconds median latency shift probed every 5 microseconds, 79.2 percent across NVLink against a 20 percent baseline, and detection in under 6 milliseconds. A mini diagram shows NVLink peer hops of about 890 nanoseconds idle rising to about 300 microseconds under load.
A hedge fund as a function
Section titled “A hedge fund as a function”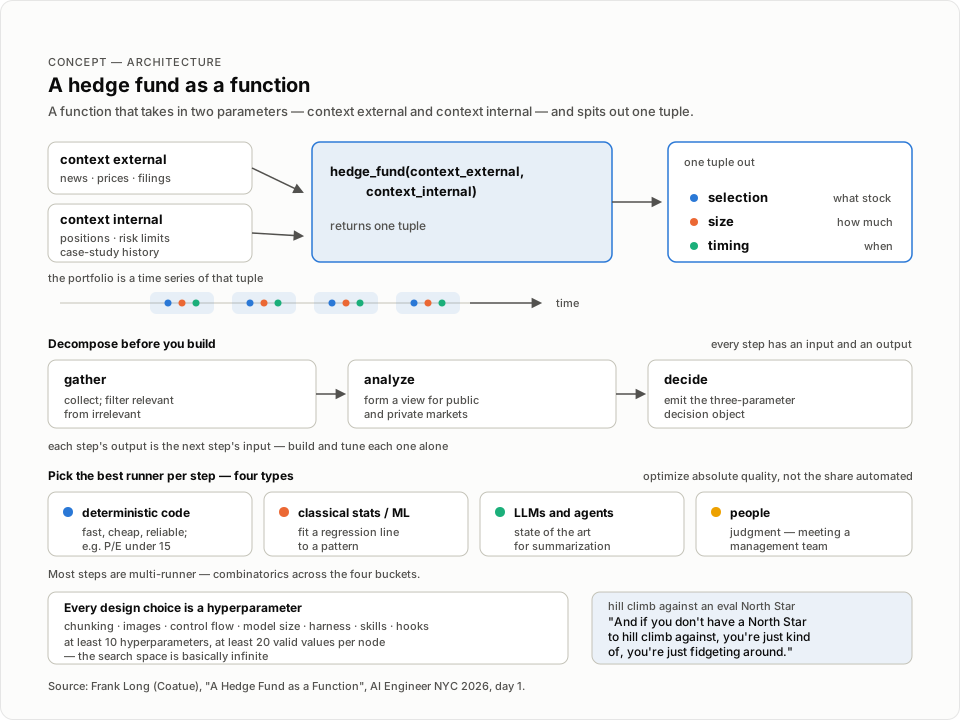
Read the figure description
Diagram of Frank Long's frame: a hedge fund is a function taking external context (news, prices, filings) and internal context (positions, risk limits, case-study history) and returning one tuple — selection, size, timing — whose time series constructs the portfolio. The function decomposes into gather, analyze, and decide steps, each run by the best of four runner types: deterministic code, classical statistics and ML, LLMs, or people.
Drawn from A Hedge Fund as a Function.
Deterministic outside, adaptive inside
Section titled “Deterministic outside, adaptive inside”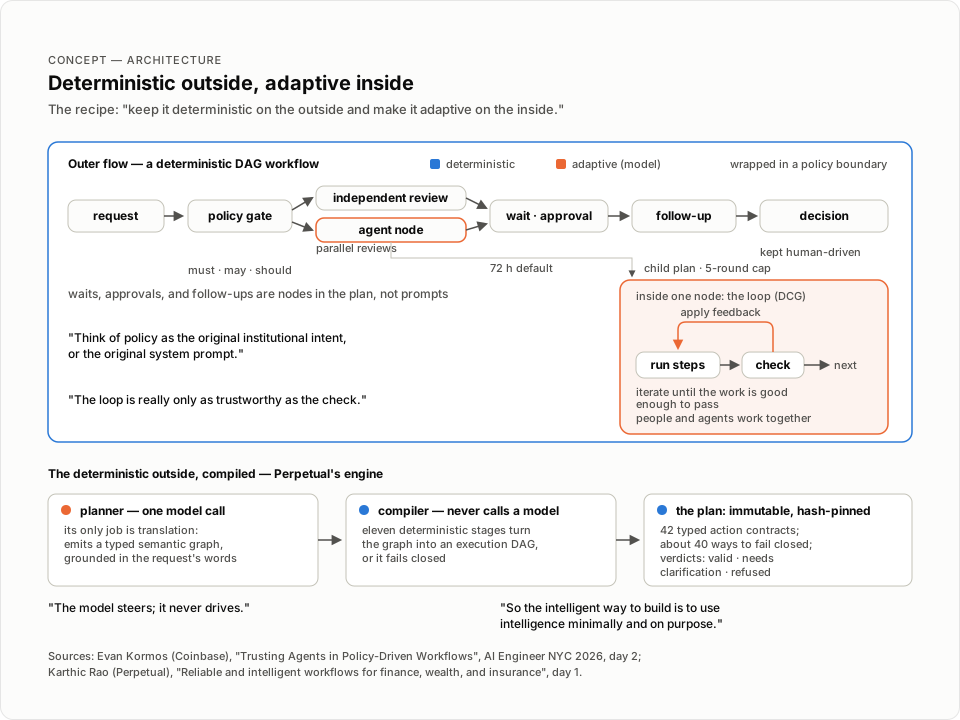
Read the figure description
Nested-box diagram. An outer deterministic DAG workflow contains policy gates, parallel reviews, and waits, approvals, and follow-ups as first-class nodes; one agent node is expanded to show the adaptive directed-cyclic-graph loop of run steps, check, and apply feedback living inside it. Below, Perpetual's engine: a planner model call emits a typed semantic graph, a compiler that never calls a model turns it into an immutable hash-pinned DAG in eleven deterministic stages, checked against 42 typed action contracts with fail-closed behavior.
Drawn from Trusting Agents in Policy-Driven Workflows · Reliable and intelligent workflows for finance, wealth, and insurance.
The five-layer agent foundation
Section titled “The five-layer agent foundation”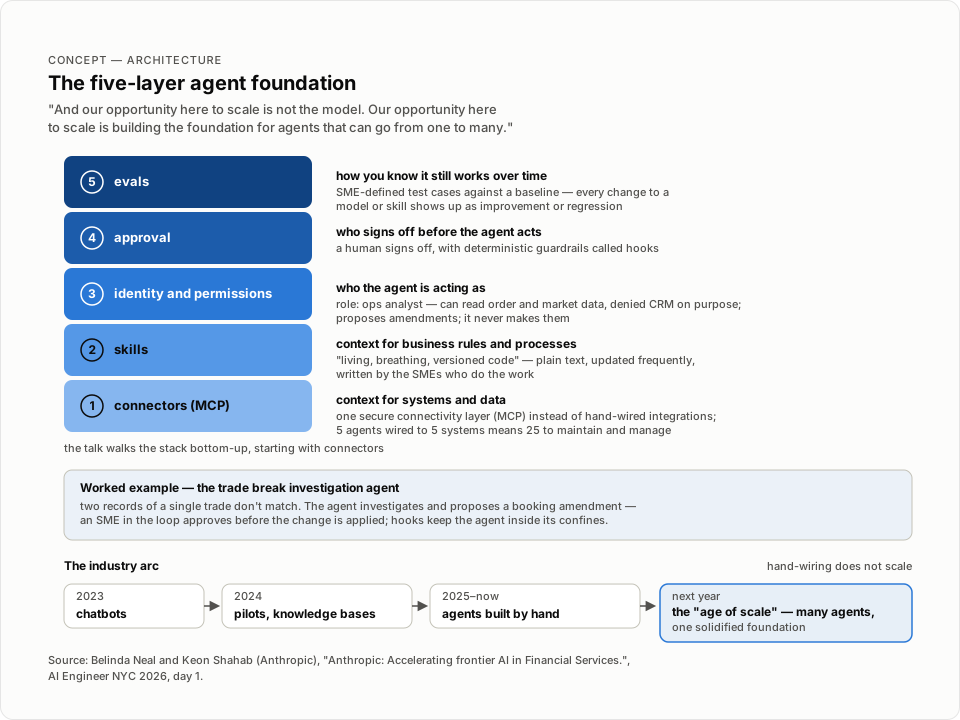
Read the figure description
A five-layer stack, walked bottom-up in the talk: connectors via MCP, skills, identity and permissions, approval, and evals. Each layer carries its one-line role and detail; a side chip gives the worked example of the trade break investigation agent, and a footer strip shows the industry arc from 2023 chatbots to the coming age of scale.
Drawn from Anthropic: Accelerating frontier AI in Financial Services..
Build the loop, not the feature
Section titled “Build the loop, not the feature”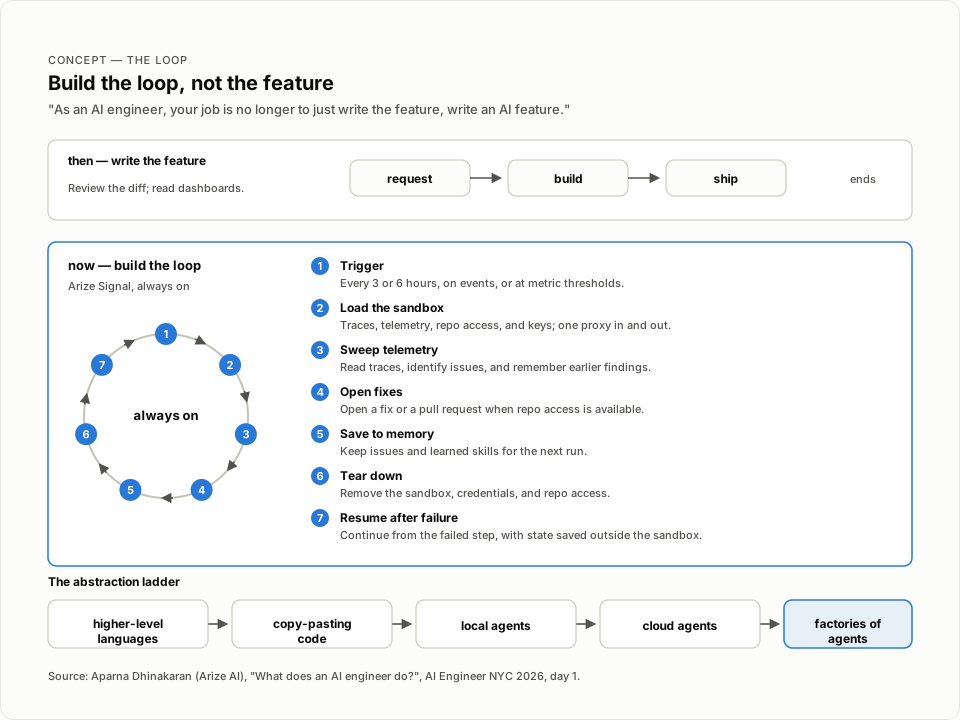
Read the figure description
Two panels. Top: the old job — a linear request, build, ship pipeline that terminates. Below: the always-on agent loop — trigger on cadence, event, or metric; a sandbox loaded with context behind a single proxy; sweep telemetry; open fixes; save issues and skills to memory; teardown credentials; durable resume from a failed step. A footer strip shows the abstraction ladder from higher-level languages to factories of agents.
Drawn from What does an AI engineer do?.
Two readers of the corpus
Section titled “Two readers of the corpus”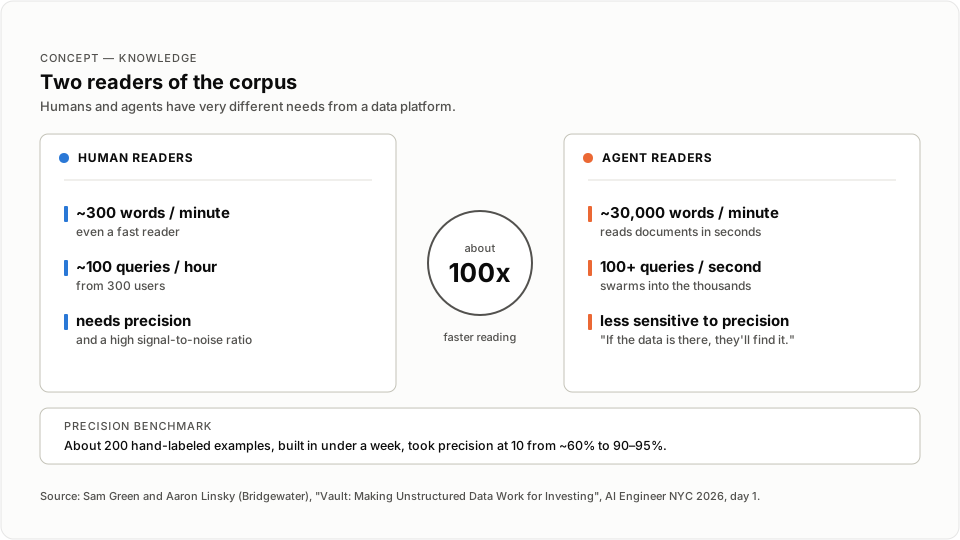
Read the figure description
Split-panel comparison of the two reader classes of Bridgewater's Vault corpus. Human readers: about 300 words per minute, about 100 queries an hour from 300 users, needing precision and a high signal-to-noise ratio. Agent readers: about 30,000 words per minute, 100-plus queries a second, swarms into the thousands, less sensitive to precision. A central callout reads about 100x faster reading. A footer chip notes that a benchmark of about 200 hand-labeled examples, built in under a week, took precision at 10 from about 60 percent to 90 to 95 percent.
Drawn from Vault: Making Unstructured Data Work for Investing.
Pets, cattle, microbes
Section titled “Pets, cattle, microbes”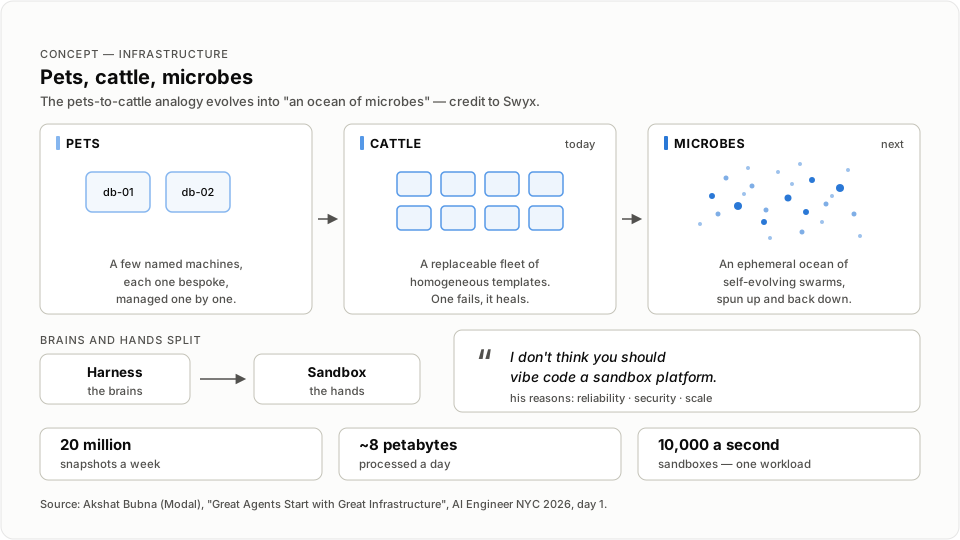
Read the figure description
Three-panel evolution of sandbox infrastructure. Pets: a few named, bespoke, hand-tended machines. Cattle: a replaceable fleet of homogeneous templates that heals when one fails, where most agent deployments sit today. Microbes: an ephemeral ocean of self-evolving sandbox swarms, spun up and back down on demand, an analogy credited to Swyx. Below, the brains-versus-hands split: the harness is the brains, the sandbox is the hands. Stats: 20 million snapshots a week, about 8 petabytes processed a day, one workload needing 10,000 sandboxes a second. Quote: "I don't think you should vibe code a sandbox platform."
Drawn from Great Agents Start with Great Infrastructure.
Autonomy is hill-climbed, not granted
Section titled “Autonomy is hill-climbed, not granted”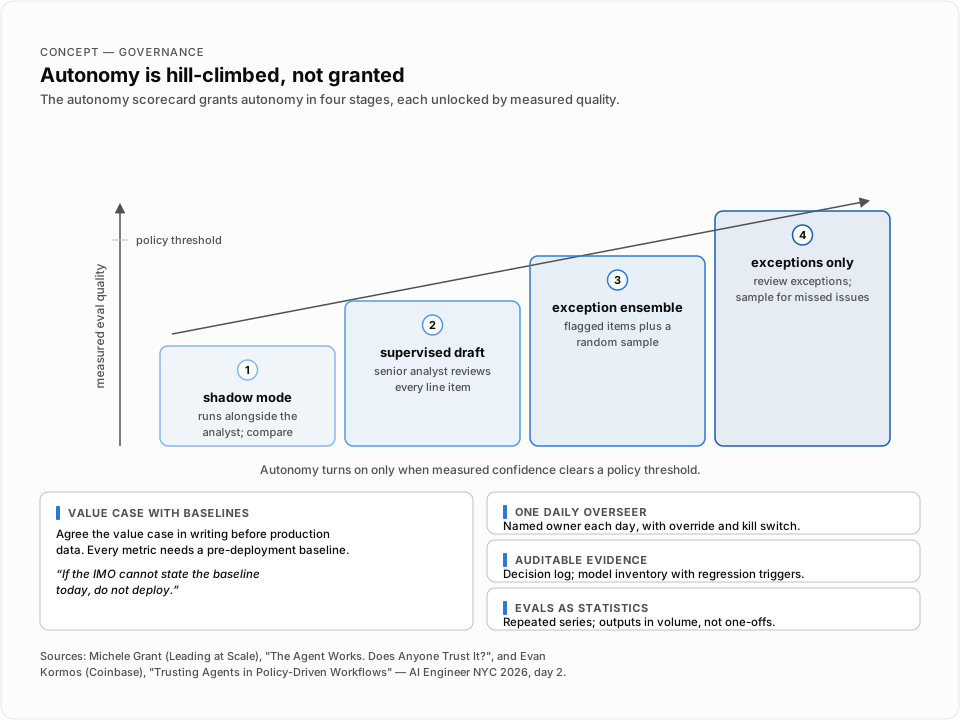
Read the figure description
A four-step ascending staircase: shadow mode, supervised draft, exception ensemble, exceptions only, with independent sampling to detect missed material issues. The uphill axis is labeled measured eval quality, with a policy threshold tick near the top. Guardrails around the staircase: a value case agreed in writing with a pre-deployment baseline per metric and the rule "If the IMO cannot state the baseline today, do not deploy"; one named daily overseer with override authority and a kill switch; an auditable decision log plus a model inventory with regression triggers; and evaluations run in repeated series as statistical analysis, outputs viewed in volume rather than as one-off direct comparisons.
Drawn from The Agent Works. Does Anyone Trust It? · Trusting Agents in Policy-Driven Workflows.
Your company has no model of itself
Section titled “Your company has no model of itself”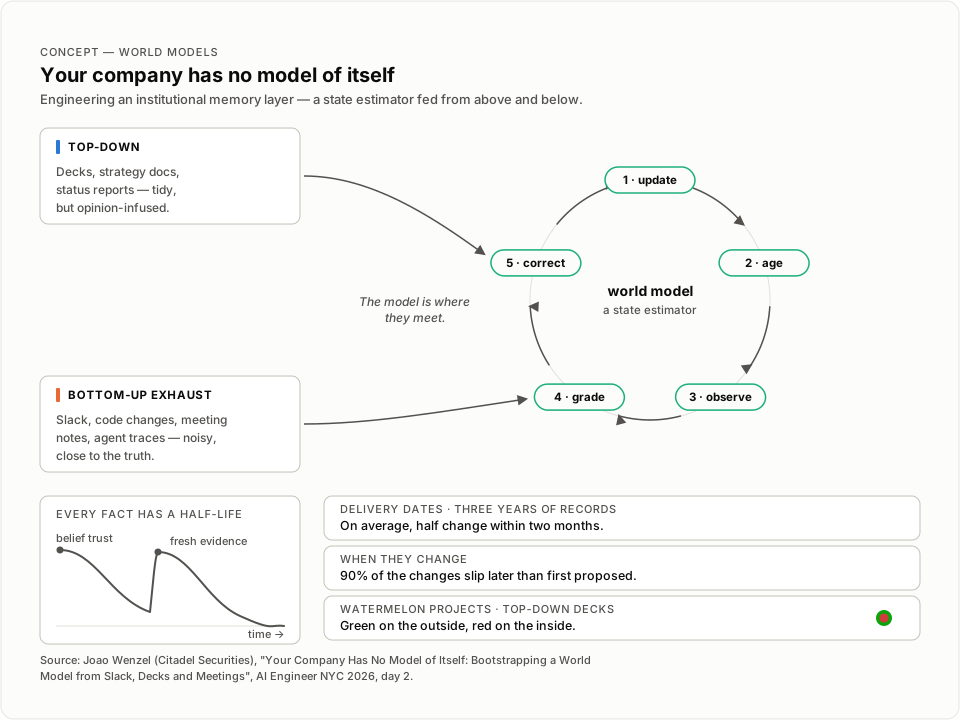
Read the figure description
A central circular loop with five stations in order: update, age, observe, grade, correct — the company world model run as a state estimator. Two input streams converge on the loop: top-down decks, strategy docs, and status reports, tidy but opinion-infused; and bottom-up exhaust — Slack, code changes, meeting notes, agent traces — noisy but close to the truth. The model is where they meet. An inset shows a decay curve with a fresh-evidence reset, illustrating that every fact has a half-life. Stat chips: on average half of delivery dates change within two months, and 90 percent of those changes slip later than first proposed. A watermelon chip notes top-down decks are green on the outside and red on the inside.
Drawn from Your Company Has No Model of Itself: Bootstrapping a World Model from Slack, Decks and Meetings.
Compute becomes a market
Section titled “Compute becomes a market”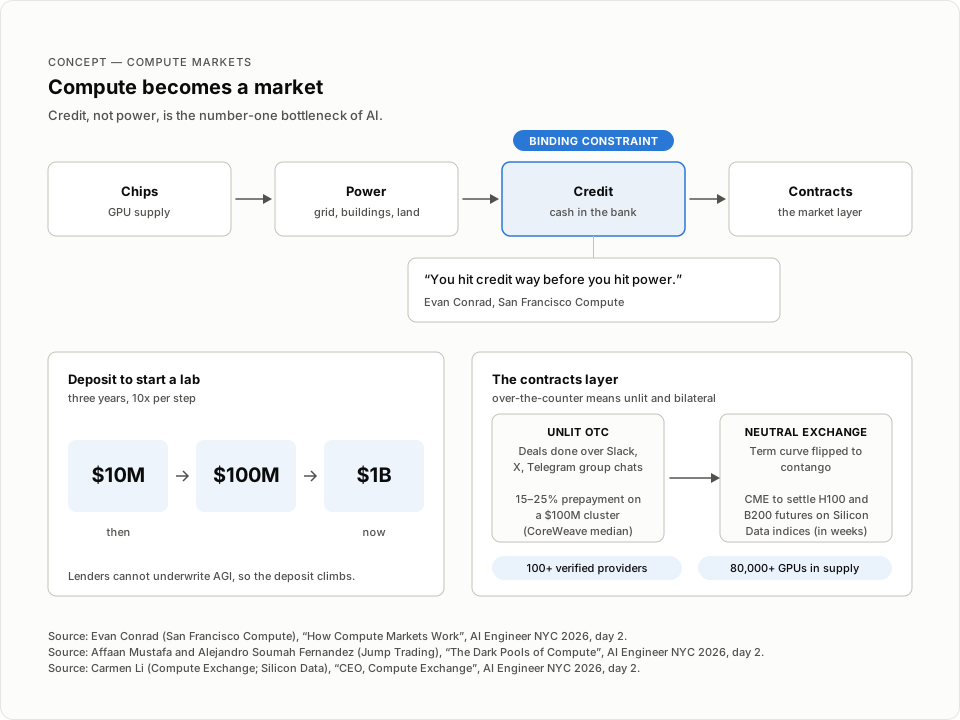
Read the figure description
Concept map of the compute supply chain. Four stations run left to right: chips (GPU supply), power, credit, and contracts. Credit is marked as the binding constraint and carries the quote "You hit credit way before you hit power." A text progression shows the deposit needed to start a lab climbing from $10 million to $100 million to $1 billion in three years. A contrast panel compares unlit over-the-counter deals done over chat, with 15 to 25 percent prepayment on a $100 million cluster, against a neutral exchange whose term curve flipped to contango and where CME will settle H100 and B200 futures on Silicon Data indices, across 100+ verified providers and 80,000+ GPUs in supply.
Drawn from How Compute Markets Work · The Dark Pools of Compute · CEO, Compute Exchange.
Data charts
Section titled “Data charts”Code is abundant, confidence is scarce
Section titled “Code is abundant, confidence is scarce”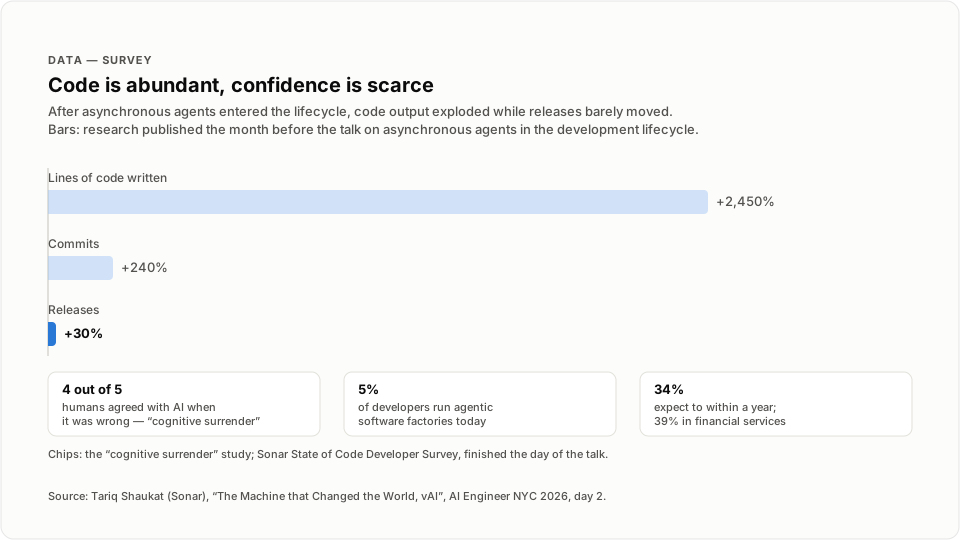
Read the figure description
Three horizontal bars compare the effect of asynchronous agents in the development lifecycle: lines of code written up 2,450 percent, commits up 240 percent, and releases up only 30 percent. The releases bar is highlighted in blue; the other two are desaturated. Side chips note that humans agreed with AI four out of five times when it was wrong, and Sonar survey figures of 5 percent of developers running agentic software factories today, 34 percent within a year, and 39 percent in financial services.
Drawn from The Machine that Changed the World, vAI.
Per-step accuracy compounds down
Section titled “Per-step accuracy compounds down”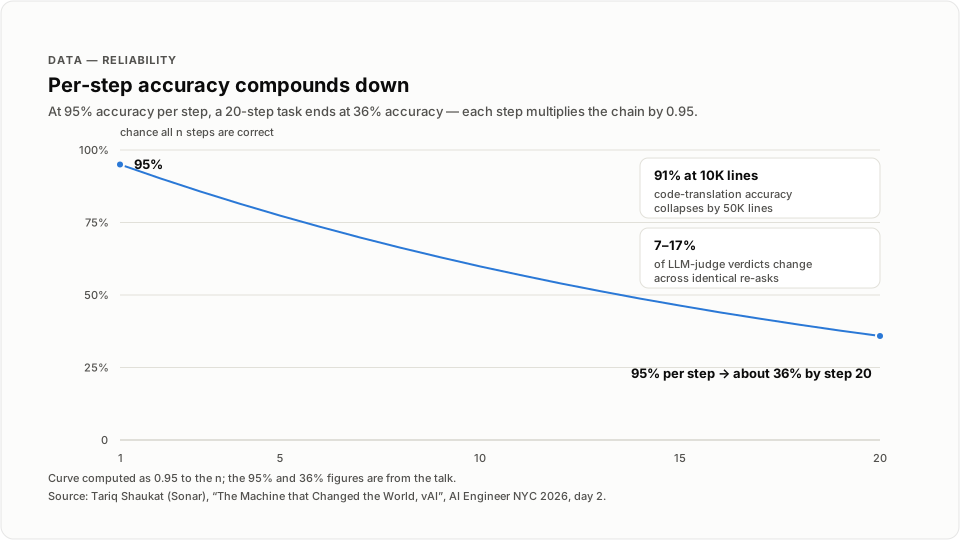
Read the figure description
A single blue line chart of 0.95 to the power n for n from 1 to 20, falling from 95 percent at step 1 to about 36 percent at step 20. Markers sit at both ends; the endpoint is annotated "95% per step becomes about 36% by step 20". Side chips note 91 percent code-translation accuracy at 10,000 lines collapsing by 50,000, and LLM-judge verdicts changing 7 to 17 percent across identical re-asks.
Drawn from The Machine that Changed the World, vAI.
Where the money goes
Section titled “Where the money goes”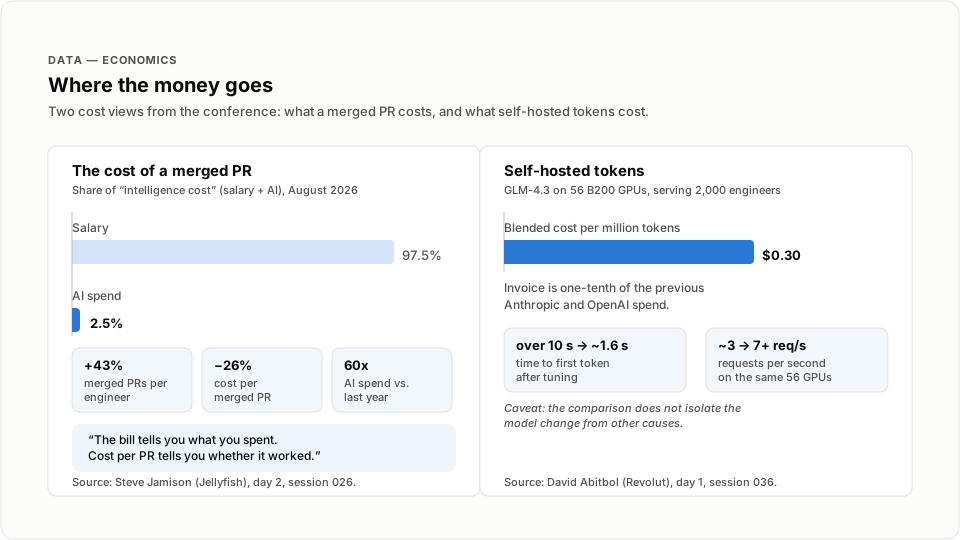
Read the figure description
Two panels. Left: the cost of a merged PR is about 97.5 percent salary and about 2.5 percent AI spend, with chips for merged PRs per engineer up 43 percent, cost per merged PR down 26 percent, and AI spend up 60 times year over year, plus a quote that the bill tells you what you spent while cost per PR tells you whether it worked. Right: self-hosted tokens at 30 cents per million, one-tenth of the previous Anthropic and OpenAI invoice, with chips for time to first token falling from over 10 seconds to about 1.6 seconds and throughput rising from about 3 to over 7 requests per second on the same 56 GPUs.
Drawn from Tokens Are the Cheap Part: AI spend, developer throughput, and cost per merged PR · Shipping like a startup, regulated like a bank.
A GPU falls to the level of the operator
Section titled “A GPU falls to the level of the operator”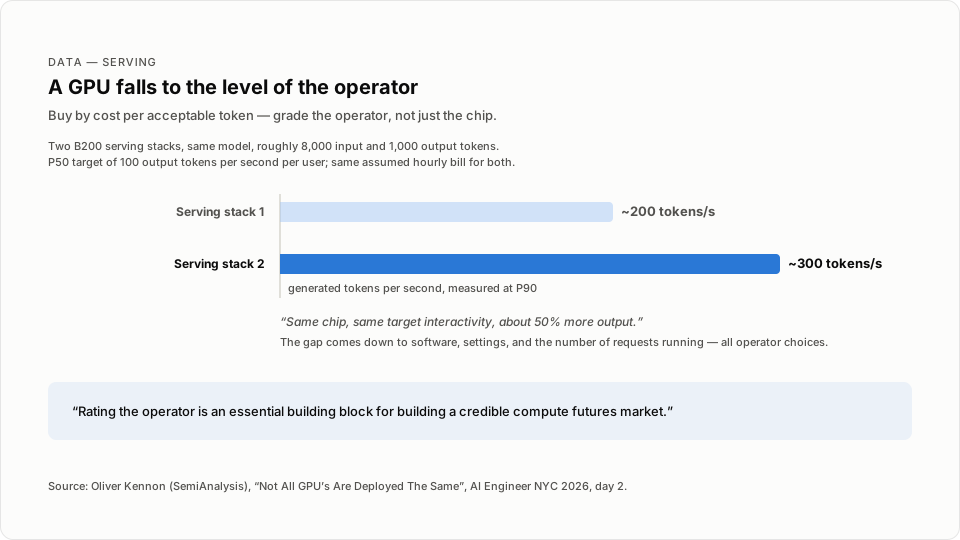
Read the figure description
Two horizontal bars compare generated output at P90 from two identical B200 serving stacks running the same model against the same interactivity target: about 200 tokens per second on one stack and about 300 on the other, roughly 50% more output from the same chip. The gap comes from software, settings, and request concurrency, all operator choices.
Drawn from Not All GPU’s Are Deployed The Same.
Right-sizing beats intuition
Section titled “Right-sizing beats intuition”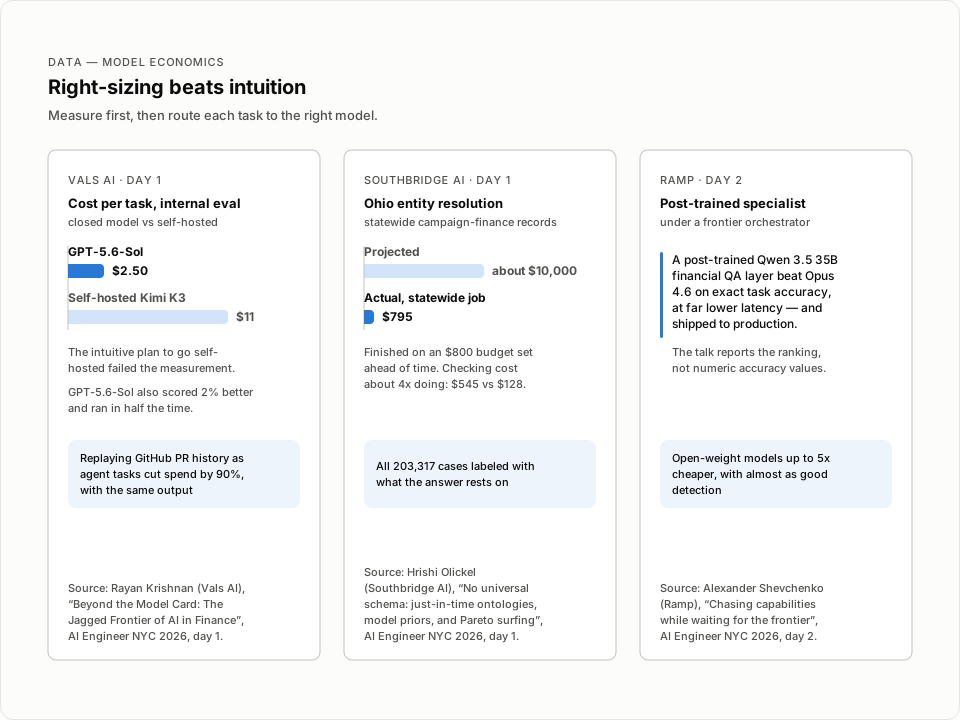
Read the figure description
Three panels on model economics. Panel one, Vals AI: cost per task on an internal eval, GPT-5.6-Sol at $2.50 per task versus self-hosted Kimi K3 at $11. Panel two, Southbridge AI: a statewide Ohio entity-resolution job projected at about $10,000 finished at $795, with checking costing about four times doing, $545 versus $128. Panel three, Ramp: a post-trained Qwen 3.5 35B specialist beat Opus 4.6 on exact task accuracy at far lower latency under a frontier orchestrator; no numeric accuracy values were given, so the claim is shown as text rather than bars.
Drawn from Beyond the Model Card: The Jagged Frontier of AI in Finance · No universal schema: just-in-time ontologies, model priors, and Pareto surfing · Chasing capabilities while waiting for the frontier.
The diffusion gap
Section titled “The diffusion gap”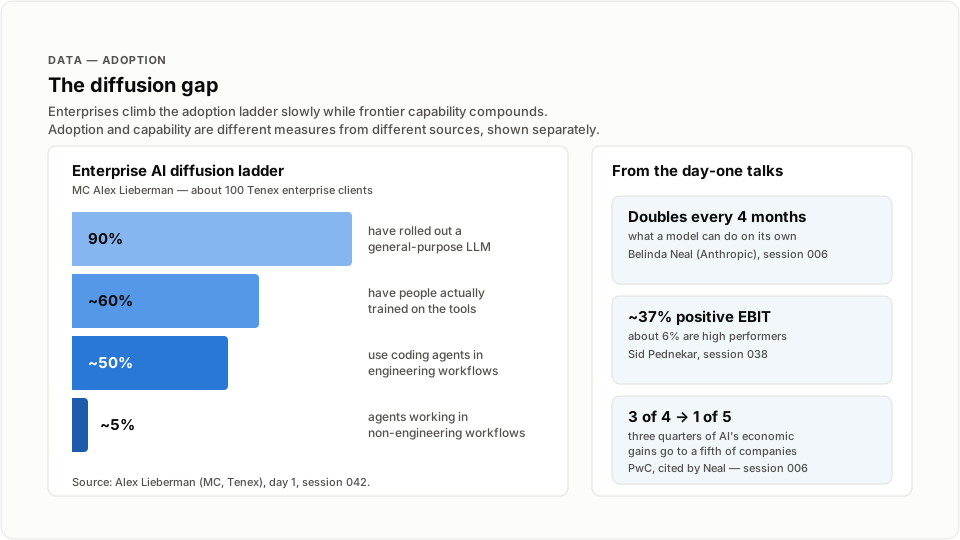
Read the figure description
Left panel: an enterprise AI diffusion ladder with four ordinal blue bands — 90 percent have rolled out a general-purpose LLM, about 60 percent have people actually trained on the tools, about 50 percent use coding agents in engineering workflows, and about 5 percent have agents working in non-engineering workflows. Right panel: three stat chips — what a model can do on its own doubles every four months (Belinda Neal, Anthropic); about 37 percent of enterprises report positive EBIT contribution and about 6 percent are high performers (Sid Pednekar); three quarters of AI's economic gains go to a fifth of companies (PwC, cited by Neal).
Drawn from Welcome Back - Featured Keynotes · Anthropic: Accelerating frontier AI in Financial Services. · Everyone Has AI. Who Has the Advantage?.
From 6 billion users to 5,000 frontier users
Section titled “From 6 billion users to 5,000 frontier users”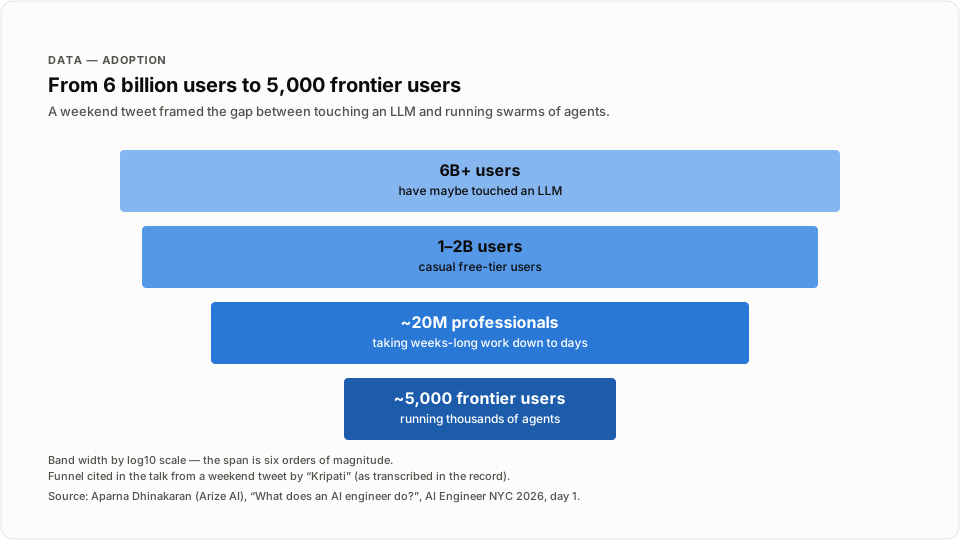
Read the figure description
A four-band funnel with widths sized by log10 of each value: 6 billion-plus users have maybe touched an LLM; 1 to 2 billion are casual free-tier users; about 20 million are professionals taking weeks-long work down to days; about 5,000 frontier users run thousands of agents. The span is six orders of magnitude, so band widths follow a log10 scale. The funnel was cited from a weekend tweet, relayed in the Arize AI talk.
Drawn from What does an AI engineer do?.